
Lately I’ve been experimenting with a CGM (Lifestyle Libre 2 as it’s pretty much all I can find here). One of the things I noticed was that the readings were delayed compared with the finger prick tests. Looking at curves and aligning on maximums, it seems to be about 10 minutes. That is usually explained by the fact that the CGM reads interstitial blood, which trails behind actual blood testing (which is implied is what the finger prick test reads).
Another thing I noticed is that the readings are consistently lower with the CGM than with the finger prick test. That leads the CGM to report hypoglycemia when if I test with my old finger tester I’m in the 70s mg/dl (~3.89 mmol/l), i.e. there is nothing to worry about. But when that happens in the middle of the night and a very loud alarm sounds to wake you up, it’s very unpleasant.
Finally, I noticed that the Abbott app, using the CGM readings, reports an estimated A1c of 4.4%, when I know from a blood test a few days ago that it’s 5.4%. It makes sense since the readings are low. However, the online report from Abbott says that my GMI is 5.2%. That’s much closer. But what’s GMI?
I searched a publication that defined it and I found the original one that explained what GMI was. In fact GMI is a nomenclature change from eA1c (estimated A1c) used before because that name confused users, especially when it diverged from lab HBA1c. The publication showed what formula is used for GMI. And indeed, that generates results based on average blood glucose levels from CGM that are pretty close to actual A1c.
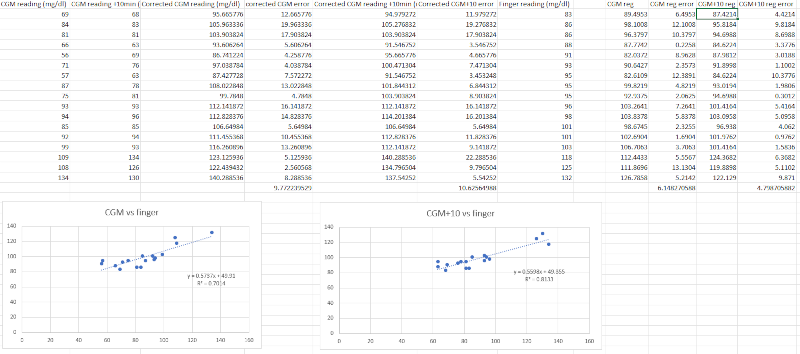
So that got me thinking: as there is a direct correlation between glucose readings and A1c, could we use the formulas to get a conversion from CGM readings to the equivalent finger prick readings? So I looked up conversions and compared the results over a few days of data: corrected CGM readings align fairly well with finger prick readings, with an error of 9.77 mg/dl on average. If I consider a 10 minutes delay, the error increases to 10.62 mg/dl on average. So that would tend to show that the 10 minutes delay isn’t real.
But then I thought: what if I simply calculate a straight linear regression without any conversion? The results are much better: the real time CGM error is 6.14 mg/dl on average, and the CGM+10 minutes error is 4.80 mg/dl. So the conversions, each with an approximation, were muddying the waters and there is in fact a 10 minutes delay and a simple linear regression formula can approximate finger prick values from CGM pretty well. I will need to wait a bit longer to collect more data to refine the formulas.
I made a simple online converter based on the CGM+10 linear regression. This is only indicative and should not be trusted and should never, ever be used to make medical decisions.